Kubelet & cAdvisor
Overview
Kubelet is a service that runs on each worker node in a Kubernetes cluster and is resposible for managing the Pods and containers on a machine. cAdvisor is a container resource usage and performance analysis tool, open sourced by Google. For monitoring Kubernetes with Prometheus we care about Kubelet and cAdvisor becuase we can scrape metrics from these services regarding container resource usage.
Deployment
We do not need to deploy a Prometheus Exporter to scrape metrics from Kublet and cAdvisor as they expose metrics endpoints out the box, therefore we only need to configure Prometheus to start scraping metrics using a ServiceMonitor.
Create a file called kubelet.yaml and add the following:
apiVersion: monitoring.coreos.com/v1
kind: ServiceMonitor
metadata:
  labels:
    app: kubelet
    serviceMonitorSelector: prometheus
  name: kubelet
  namespace: prometheus
spec:
  endpoints:
  - bearerTokenFile: /var/run/secrets/kubernetes.io/serviceaccount/token
    honorLabels: true
    interval: 30s
    port: http-metrics
    scheme: http
    tlsConfig:
      insecureSkipVerify: true
  - bearerTokenFile: /var/run/secrets/kubernetes.io/serviceaccount/token
    honorLabels: true
    interval: 30s
    path: /metrics/cadvisor
    port: http-metrics
    scheme: http
    tlsConfig:
      insecureSkipVerify: true
  jobLabel: kubelet
  namespaceSelector:
    matchNames:
    - kube-system
  selector:
    matchLabels:
      k8s-app: kubelet
The ServiceMonitor defined in the YAML above will scrape the /metrics and /metrics/cadvisor endpoints on Kubelet via the kubelet Service in the kube-system namespace. It is worth noting, the configuration of Kubelet may differ depending your Kubernetes environment. The example above is tested to work on GCP Kubernetes Engine.
Go ahead and install the ServiceMonitor into your Kubernetes cluster by executing kubectl apply -f kubelet.yaml.
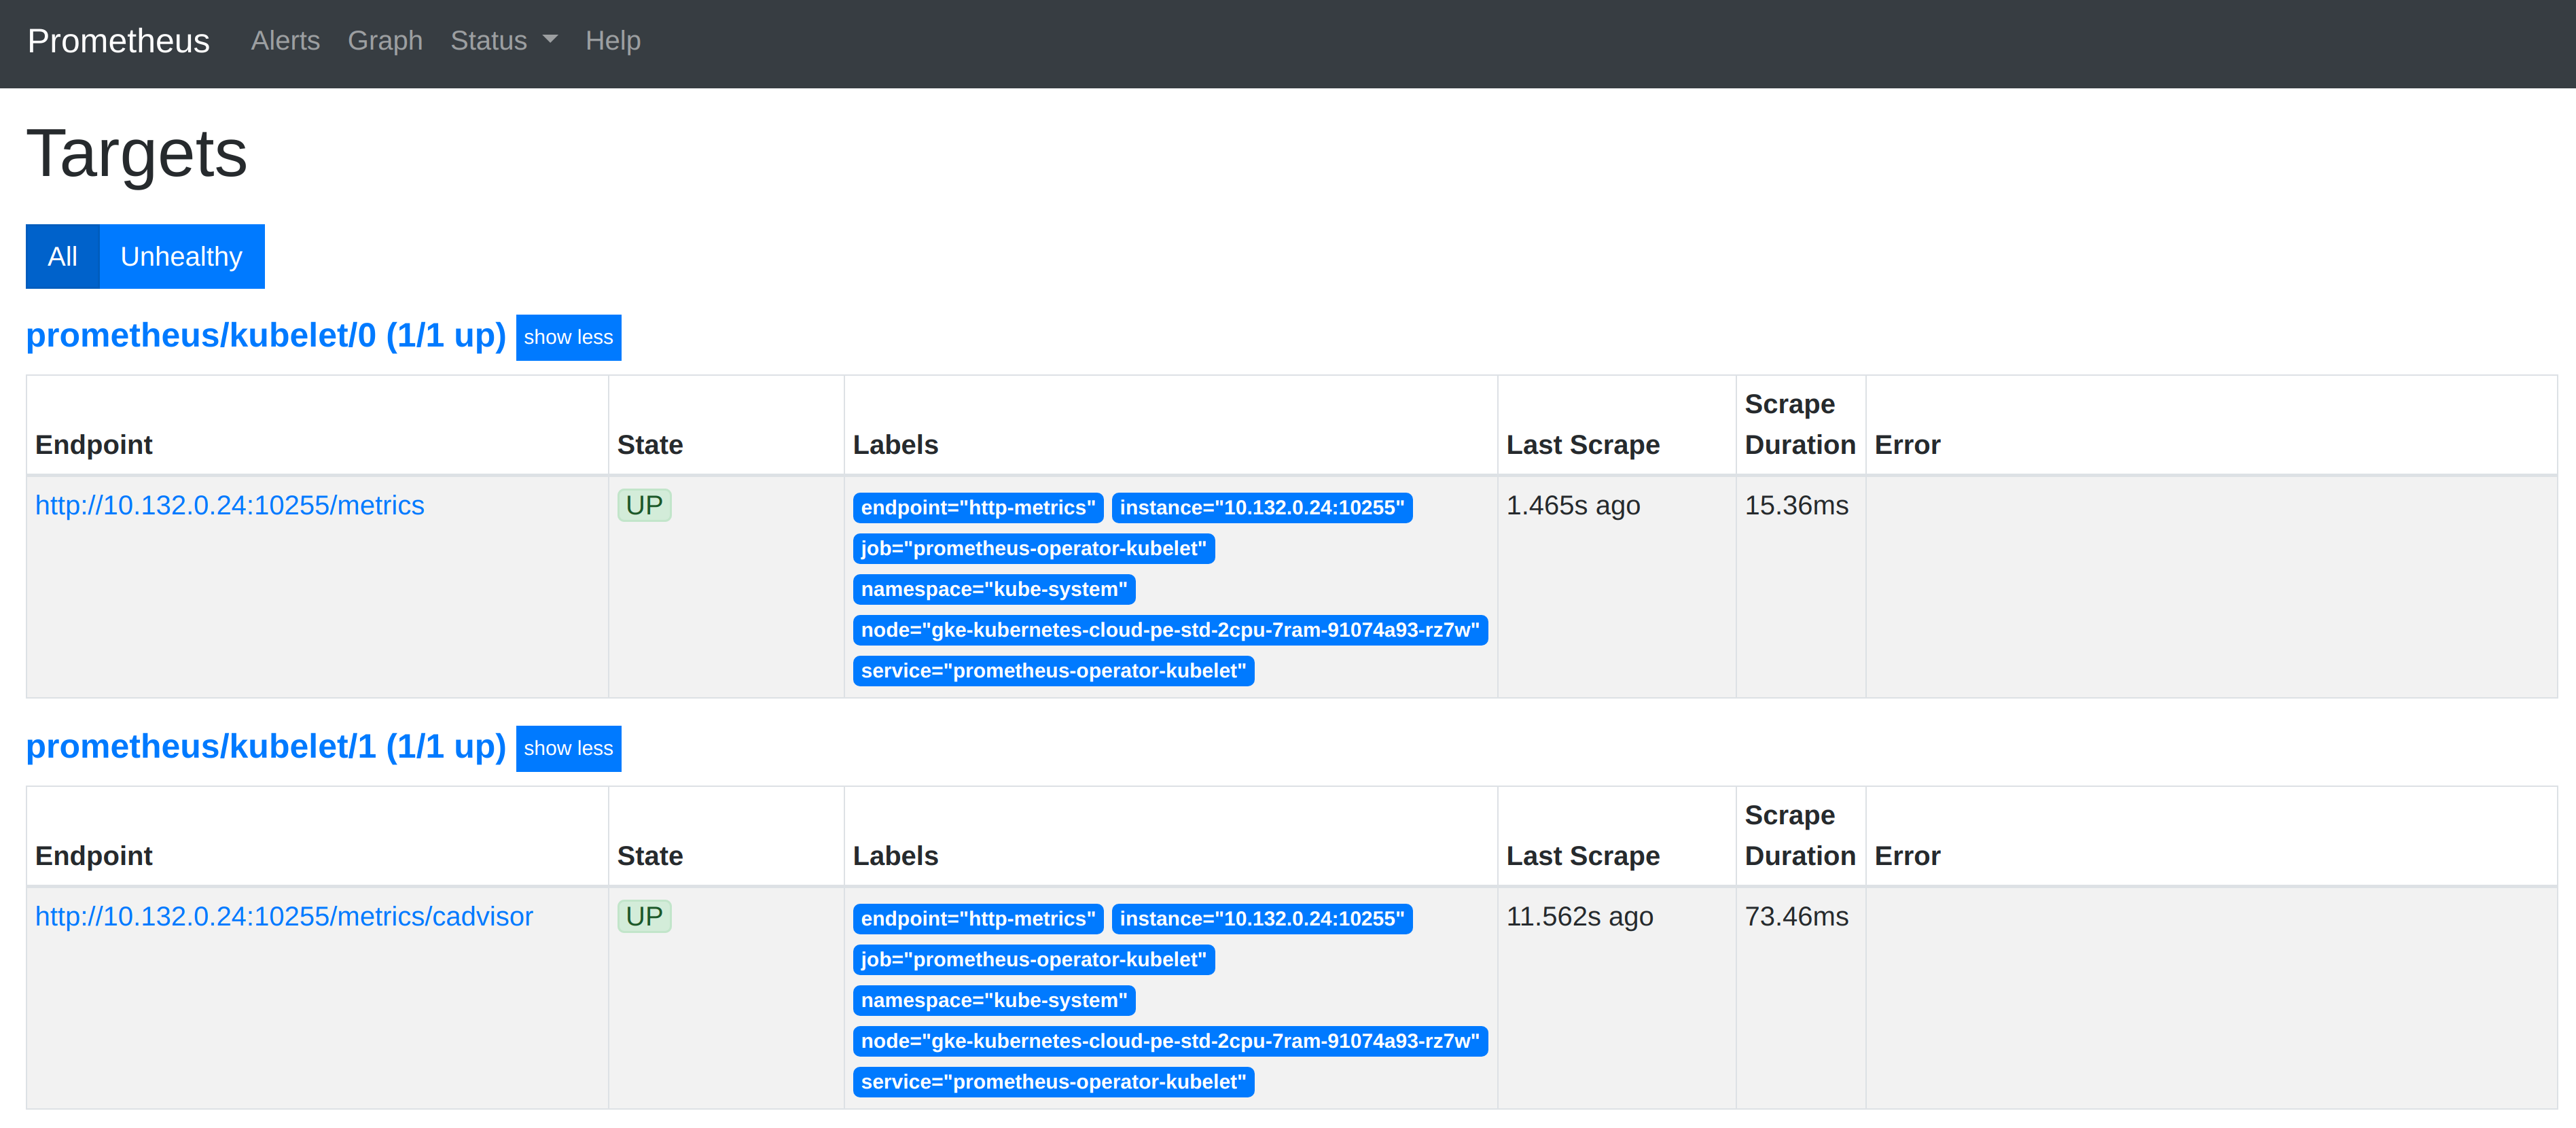
After a few moments, you will see two Targets being scraped by Prometheus.
Useful Metrics
There are many useful metrics exposed by Kubelet for container resource usage.
Lets start by looking at CPU usage metrics:
container_cpu_system_seconds_total- Usage of system CPU timecontainer_cpu_user_seconds_total- Usage of user CPU timecontainer_cpu_usage_seconds_total- Total CPU usage time (system + user)
There are a number of metrics available for memory but to best track the actual memory usage of a Pod use the container_memory_working_set_bytes metric.
These metrics include the labels pod_name and namespace to help you identify the resource usage of specifics Pods per Kubernetes Namespace.