High Availability
Out of the box Prometheus does not have any concept of high availability or redundancy. Prometheus itself may be a mature and reliable product but not everything is foolproof and you should always plan for when a Kubernetes worker node fails, not if it fails, and therefore we must be able to tolerate a Prometheus Pod restarting from time to time. Before we look at Thanos, lets see how we could tackle this problem with just Kubernetes & Prometheus.
High Availability with Kubernetes
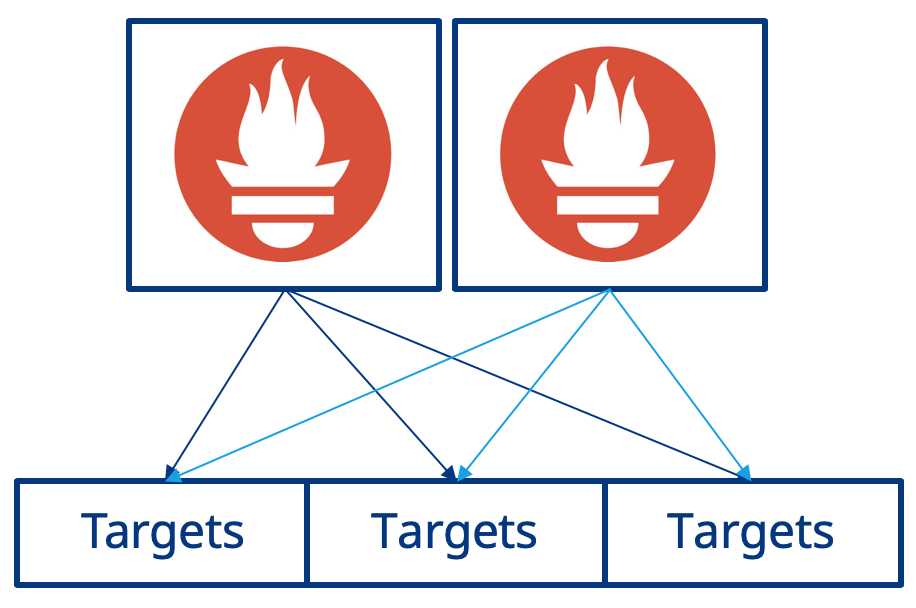
Earlier in this chapter we used the Prometheus Operator to launch a single instance of Prometheus within Kubernetes. To avoid the scenario of metrics being unavailable, either permanently or for a short duration of time, we can run a second instance of Prometheus. Each instance of Prometheus will run independent of the other, however each still have the same configuration as set by the Prometheus Operator. Essentially, two copies of target metrics will be scraped, as shown below:
Now lets update the previous prometheus.yaml file to support this new architecture. We need to change the replicas from 1 to 2 and then also add a podAntiAffinity to ensure that both instances of Prometheus are running on different Kubernetes worker nodes to ensure we truly benefit from having the additional redundant instance of Prometheus.
apiVersion: monitoring.coreos.com/v1
kind: Prometheus
metadata:
  name: prometheus
  namespace: prometheus
spec:
  affinity:
    podAntiAffinity:
      preferredDuringSchedulingIgnoredDuringExecution:
      - weight: 100
        podAffinityTerm:
          labelSelector:
            matchExpressions:
            - key: app
              operator: In
              values:
              - prometheus
          topologyKey: kubernetes.io/hostname
  baseImage: quay.io/prometheus/prometheus
  logLevel: info
  podMetadata:
    annotations:
      cluster-autoscaler.kubernetes.io/safe-to-evict: "true"
    labels:
      app: prometheus
  replicas: 2
  resources:
    limits:
      cpu: 1
      memory: 2Gi
    requests:
      cpu: 1
      memory: 2Gi
  retention: 12h
  serviceAccountName: prometheus-service-account
  serviceMonitorSelector:
    matchLabels:
      serviceMonitorSelector: prometheus
  storage:
    volumeClaimTemplate:
      apiVersion: v1
      kind: PersistentVolumeClaim
      metadata:
        name: prometheus-pvc
      spec:
        accessModes:
        - ReadWriteOnce
        resources:
          requests:
            storage: 10Gi
  version: v2.10.0
---
apiVersion: v1
kind: ServiceAccount
metadata:
  name: "prometheus-service-account"
  namespace: "prometheus"
---
apiVersion: rbac.authorization.k8s.io/v1
kind: ClusterRole
metadata:
  name: "prometheus-cluster-role"
rules:
- apiGroups:
  - ""
  resources:
  - nodes
  - services
  - endpoints
  - pods
  verbs:
  - get
  - list
  - watch
- apiGroups:
  - ""
  resources:
  - nodes/metrics
  verbs:
  - get
- nonResourceURLs:
  - "/metrics"
  verbs:
  - get
---
apiVersion: rbac.authorization.k8s.io/v1
kind: ClusterRoleBinding
metadata:
  name: "prometheus-cluster-role-binding"
roleRef:
  apiGroup: rbac.authorization.k8s.io
  kind: ClusterRole
  name: "prometheus-cluster-role"
subjects:
- kind: ServiceAccount
  name: "prometheus-service-account"
  namespace: prometheus
Lets apply this updated prometheus.yaml to Kubernetes by running kubectl apply -f prometheus.yaml.
A moment or two after applying this, check the running Pods in the prometheus namespace by running kubectl get pods --namespace prometheus:
$kubectl get pods --namespace prometheus
NAME                                            READY   STATUS    RESTARTS   AGE
prometheus-operator-operator-86bc4d5568-7k6tp   1/1     Running   0          23h
prometheus-prometheus-0                         3/3     Running   0          2d
prometheus-prometheus-1                         3/3     Running   0          1m10s
Now lets put the reliability of this to the test:
- Reconnect to Prometheus by executing
kubectl port-forward service/prometheus-operated 9090:9090 --namespace prometheusand then access the UI at https://localhost:9090 - Restart one of the instances of Prometheus by running
kubectl delete pod prometheus-prometheus-0 --namespace prometheus - Immediately then check the Prometheus UI in your web browser, you will see that it is still available!
This is great however there is one thing we need to think about. If we have two instances of Prometheus with two copies of of the same metrics, which should we use?
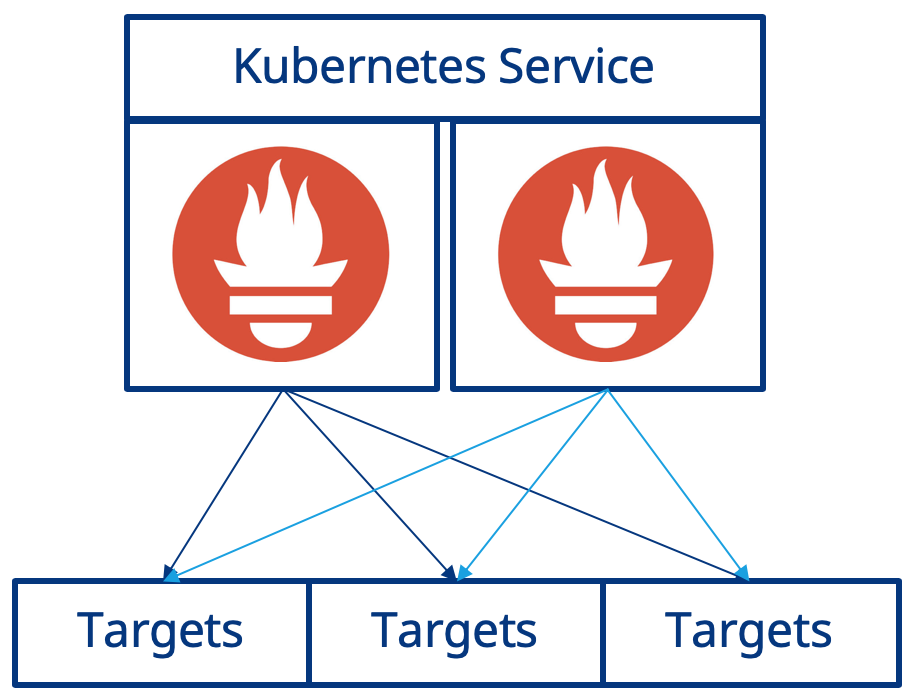
Your Prometheus deployment uses a Kubernetes Service and in the previous example you used Kubectl port-forwarding, connecting to the Kubernetes Service directly, and therefore taking advantage of Kubernetes internal load balancing functionality. You have essentially have implemented the illustration below:
So when you connect to Prometheus via the Kuberneres Service the request will be serviced by one of the running Prometheus instances. However, when you make subsequent requests there is no guarantee that the request will be serviced by the same instance. Why is this an issue? The two instances of Prometheus that are running are independent of each other and while they do have the same scrape configuration there is no guarantee that they will scrape the targets at exactly the same time, therefore the time series metrics that they each collect may have different values.
What this all means is, each time you connect to Prometheus via the load balanced Kubernetes Service, you may see some oddness with metrics changing. When visualizing the metrics over time with dashboarding tools such as Grafana, this leads to a really poor experience for users, as each time you reload the same graph it may appear differently in the same time period. This is now where Thanos can help!
High Availability with Thanos
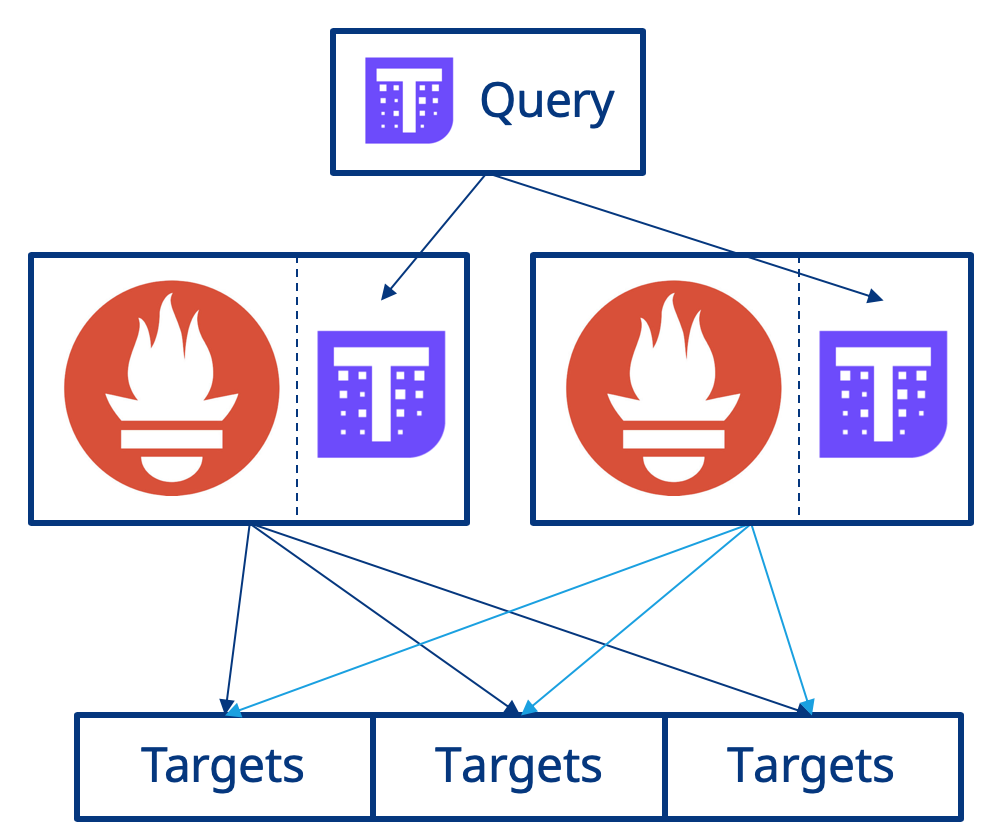
At a high level, HA for Prometheus with Thanos works as detailed below:
- First a sidecar is deployed alongside the Prometheus container and interacts with Prometheus. A sidecar is an additional container within the Kubernetes Pod running alongside other containers.
- Next, an additional service is deployed called Thanos Query and is configured to be aware of of all instances of the Thanos Sidecar.
- Thanos Query communicates with the Thanos Sidecar via gRPC and de-duplicates metrics across all instances of Prometheus when executing a query. Query exposes users to a Prometheus-esuqe user interfance and also exposes the Prometheus API.
The diagram below shows this:
Now lets look at implementing this!
The Prometheus Operator supports the configuration of the Thanos Sidecar via the Prometheus CRD, so you simply need to update the existing deployment. You then also need to deploy the Thanos Query service and configure this to federate the instances of Prometheus that are running. You will use a Kubernetes Service as a mechanism of service discovery for configuring Thanos Query to identify the Prometheus instances, to do this you also need to add an additional Kubernetes Pod Label to the Prometheus Pods so you can select them with the label selector on the Kubernetes Service.
Finally, you must also set an external label for the Prometheus instances to use. The external label is required by Thanos and is used as a method of labelling all metrics that are derived from a particular instance of Thanos Query.
Update the Prometheus resource adding the thanos configuration, the new service discovery label, and also configure an external label for the Prometheus instances:
spec:
  podMetadata:
    labels:
      thanos-store-api: "true"
  thanos:
    version: v0.4.0
    resources:
      limits:
        cpu: 500m
        memory: 500Mi
      requests:
        cpu: 100m
        memory: 500Mi
  externalLabels:
    cluster_environment: workshop
Then define a Kubernetes Deployment for Thanos Query and the Kubernetes Service for the purposes of service discovery by adding the below to prometheus.yaml also:
---
apiVersion: apps/v1
kind: Deployment
metadata:
  name: thanos-query
  namespace: prometheus
  labels:
    app: thanos-query
spec:
  replicas: 1
  selector:
    matchLabels:
      app: thanos-query
  template:
    metadata:
      labels:
        app: thanos-query
    spec:
      containers:
      - name: thanos-query
        image: improbable/thanos:v0.5.0
        resources:
          limits:
            cpu: 500m
            memory: 500Mi
          requests:
            cpu: 100m
            memory: 500Mi
        args:
        - "query"
        - "--log.level=debug"
        - "--query.replica-label=prometheus_replica"
        - "--store.sd-dns-resolver=miekgdns"
        - "--store=dnssrv+_grpc._tcp.thanos-store-api.prometheus.svc.cluster.local"
        ports:
        - name: http
          containerPort: 10902
        - name: grpc
          containerPort: 10901
        - name: cluster
          containerPort: 10900
---
apiVersion: v1
kind: Service
metadata:
  name: "thanos-store-api"
  namespace: prometheus
spec:
  type: ClusterIP
  clusterIP: None
  ports:
  - name: grpc
    port: 10901
    targetPort: grpc
  selector:
    thanos-store-api: "true"
The updated prometheus.yaml file should be similar to the example here.
Now apply this to Kubernetes by executing kubectl apply -f prometheus.yaml. You wil see two things occur, the new Thanos Query service will be deployed as a Pod and the existing Prometheus Pods will be restarted since the new Pod Label and Sidecar are to be added:
$kubectl get pods --namespace prometheus
NAME                                            READY   STATUS              RESTARTS   AGE
prometheus-operator-operator-86bc4d5568-94cpf   1/1     Running             0          18m
prometheus-prometheus-0                         0/4     ContainerCreating   0          1s
prometheus-prometheus-1                         0/4     Pending             0          1s
thanos-query-58bcc6dcbb-67rn4                   0/1     ContainerCreating   0          4s

$kubectl get pods --namespace prometheus
NAME                                            READY   STATUS              RESTARTS   AGE
prometheus-operator-operator-86bc4d5568-94cpf   1/1     Running             0          19m
prometheus-prometheus-0                         4/4     Running             0          1m
prometheus-prometheus-1                         4/4     Running             0          1m
thanos-query-58bcc6dcbb-67rn4                   1/1     Running             0          1m
You can see that Pods prometheus-prometheus-0 and prometheus-prometheus-1 now show 4/4 on the container readiness. Previously this only showed 3 containers, but following this change there are now 4 containers in a Prometheus Pod due to the additional Thanos Sidecar.
Now connect to Thanos Query using port forwarding by executing a Kubectl command. You will need to substitute the correct name of your Thanos Query Pod. For example: kubectl port-forward pod/thanos-query-58bcc6dcbb-67rn4 10902:10902 --namespace prometheus.
When accessing http://localhost:10902 in your web browser you will see that the Thanos Query UI is awfully similar to the Prometheus UI. That is no accident, Thanos is actually based on the same codebase as Prometheus.
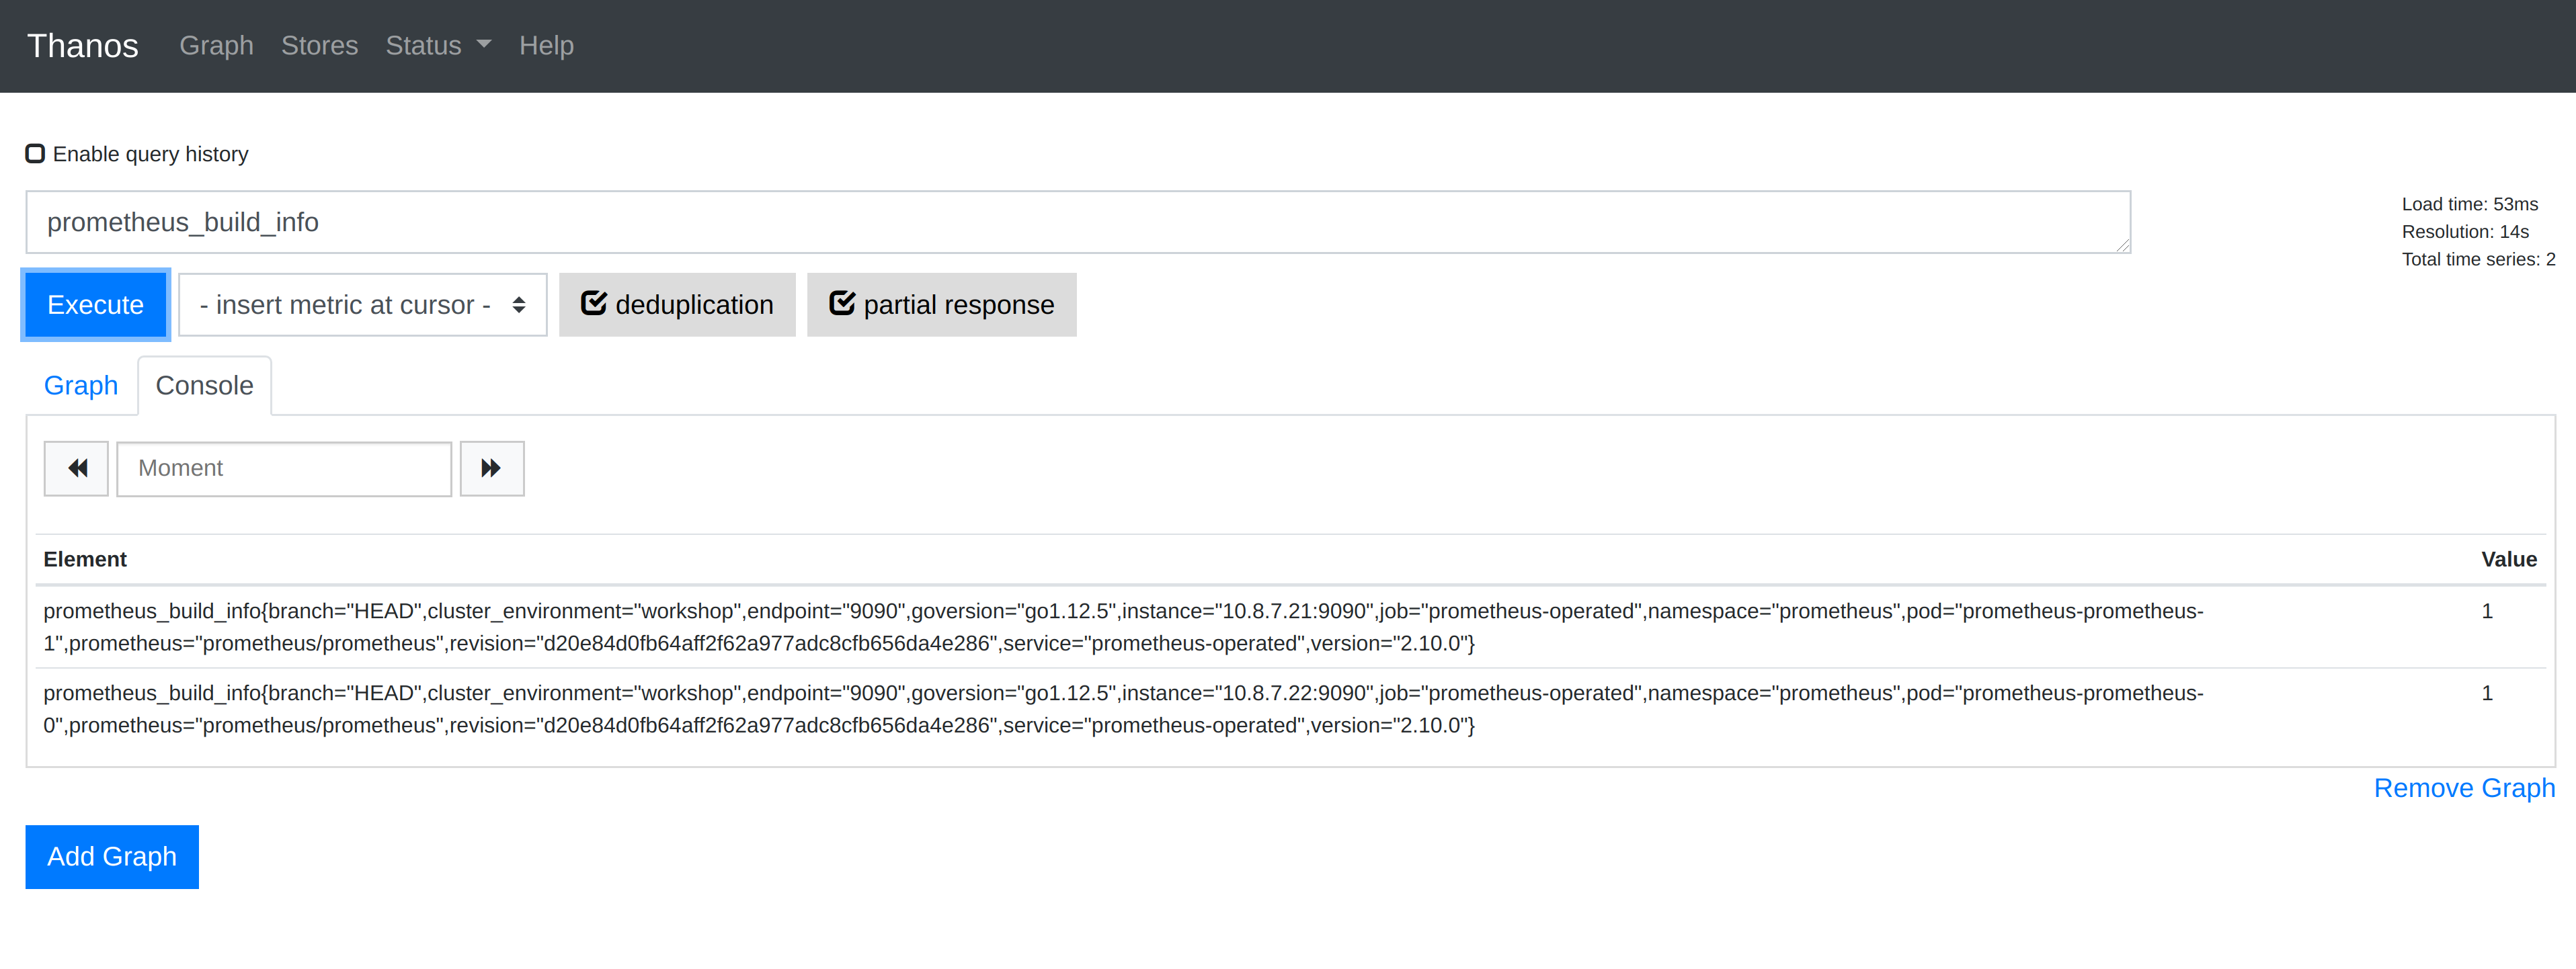
When running a Prometheus query in Thanos you can see a checkbox named deduplication. If you experiment running Prometheus queries with this option enabled and disable you will see how Thanos deduplicates the metrics in the available Prometheus instances when querying.
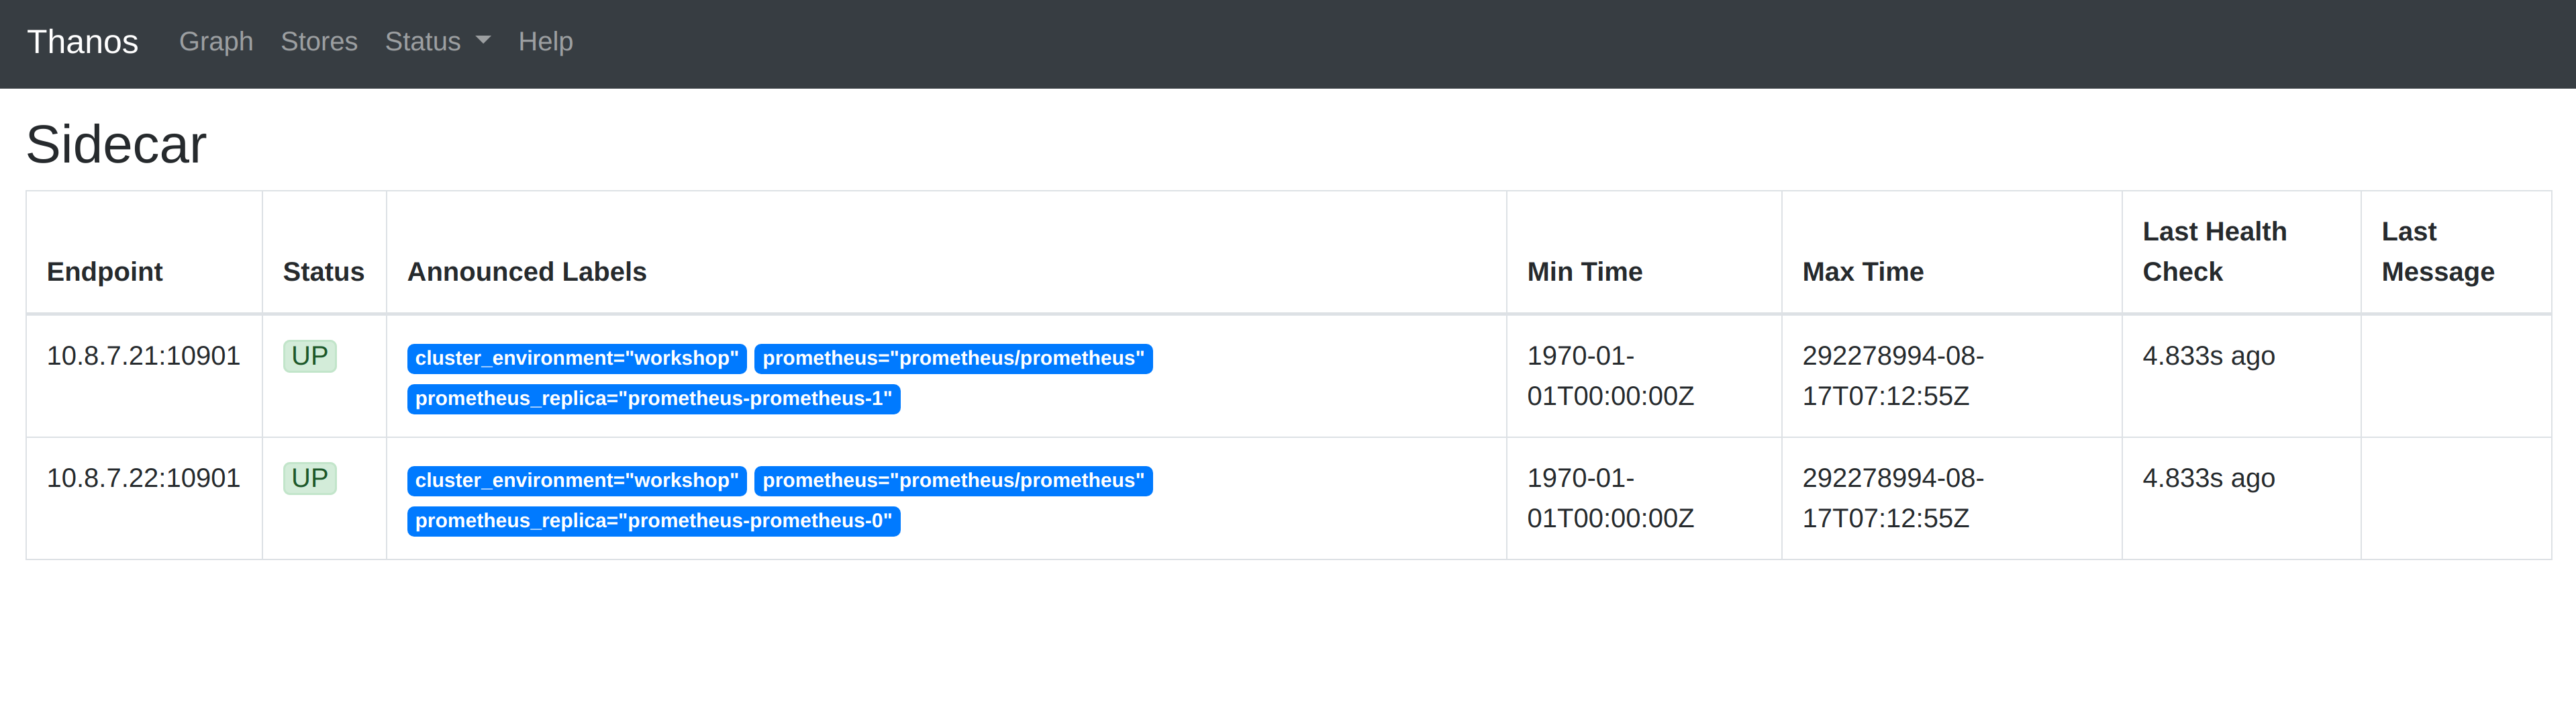
If you select the Stores option in the menu at the top, Thanos Query has a interface for showing the Thanos Store API endpoints it is currently federating. When you check this, you will see the two Prometheis intances that are running, as shown below:
Conclusion
Success! In this tutorial you have successfully implemented Prometheus running with high availability using Thanos.