Kube State Metrics
Overview
The kube-state-metrics application extracts metrics from Kubernetes about the state of the different types of objects in Kubernetes such as, Pods, Deployments, StatefulSets, etc.
The project itself describes itself pretty well:
kube-state-metrics is a simple service that listens to the Kubernetes API server and generates metrics about the state of the objects. (See examples in the Metrics section below.) It is not focused on the health of the individual Kubernetes components, but rather on the health of the various objects inside, such as deployments, nodes and pods.

kube-state-metrics is about generating metrics from Kubernetes API objects without modification. This ensures that features provided by kube-state-metrics have the same grade of stability as the Kubernetes API objects themselves. In turn, this means that kube-state-metrics in certain situations may not show the exact same values as kubectl, as kubectl applies certain heuristics to display comprehensible messages. kube-state-metrics exposes raw data unmodified from the Kubernetes API, this way users have all the data they require and perform heuristics as they see fit.

The metrics are exported on the HTTP endpoint /metrics on the listening port (default 80). They are served as plaintext. They are designed to be consumed either by Prometheus itself or by a scraper that is compatible with scraping a Prometheus client endpoint. You can also open /metrics in a browser to see the raw metrics.
Deployment
To use kube-state-metrics we need to deploy a single replica of kube-state-metrics as a Pod in the target Kubernetes cluster.
Create a file called kube-state-metrics.yaml and add the following:
---
apiVersion: v1
kind: ServiceAccount
metadata:
  labels:
    app: kube-state-metrics
  name: kube-state-metrics
  namespace: prometheus
---
apiVersion: rbac.authorization.k8s.io/v1
kind: ClusterRole
metadata:
  name: kube-state-metrics
rules:
- apiGroups: [""]
  resources:
  - configmaps
  - secrets
  - nodes
  - pods
  - services
  - resourcequotas
  - replicationcontrollers
  - limitranges
  - persistentvolumeclaims
  - persistentvolumes
  - namespaces
  - endpoints
  verbs: ["list", "watch"]
- apiGroups: ["extensions"]
  resources:
  - daemonsets
  - deployments
  - replicasets
  - ingresses
  verbs: ["list", "watch"]
- apiGroups: ["apps"]
  resources:
  - daemonsets
  - deployments
  - replicasets
  - statefulsets
  verbs: ["list", "watch"]
- apiGroups: ["batch"]
  resources:
  - cronjobs
  - jobs
  verbs: ["list", "watch"]
- apiGroups: ["autoscaling"]
  resources:
  - horizontalpodautoscalers
  verbs: ["list", "watch"]
- apiGroups: ["policy"]
  resources:
  - poddisruptionbudgets
  verbs: ["list", "watch"]
- apiGroups: ["certificates.k8s.io"]
  resources:
  - certificatesigningrequests
  verbs: ["list", "watch"]
- apiGroups: ["storage.k8s.io"]
  resources:
  - storageclasses
  verbs: ["list", "watch"]
- apiGroups: ["autoscaling.k8s.io"]
  resources:
  - verticalpodautoscalers
  verbs: ["list", "watch"]
---
apiVersion: rbac.authorization.k8s.io/v1
kind: ClusterRoleBinding
metadata:
  labels:
    app: kube-state-metrics
  name: kube-state-metrics
roleRef:
  apiGroup: rbac.authorization.k8s.io
  kind: ClusterRole
  name: kube-state-metrics
subjects:
- kind: ServiceAccount
  name: kube-state-metrics
  namespace: prometheus
---
apiVersion: extensions/v1beta1
kind: Deployment
metadata:
  labels:
    app: kube-state-metrics
  name: kube-state-metrics
  namespace: prometheus
spec:
  replicas: 1
  selector:
    matchLabels:
      app: kube-state-metrics
  strategy:
    rollingUpdate:
      maxSurge: 1
      maxUnavailable: 0
    type: RollingUpdate
  template:
    metadata:
      labels:
        app: kube-state-metrics
    spec:
      containers:
      - image: gcr.io/google_containers/kube-state-metrics:v1.6.0
        imagePullPolicy: IfNotPresent
        livenessProbe:
          failureThreshold: 3
          httpGet:
            path: /
            port: 8080
            scheme: HTTP
          initialDelaySeconds: 30
          periodSeconds: 10
          successThreshold: 1
          timeoutSeconds: 30
        name: kube-state-metrics
        ports:
        - containerPort: 8080
          protocol: TCP
        readinessProbe:
          failureThreshold: 3
          httpGet:
            path: /
            port: 8080
            scheme: HTTP
          initialDelaySeconds: 30
          periodSeconds: 10
          successThreshold: 1
          timeoutSeconds: 5
        resources:
          limits:
            cpu: 500m
            memory: 768Mi
          requests:
            cpu: 250m
            memory: 768Mi
      restartPolicy: Always
      serviceAccount: kube-state-metrics
      serviceAccountName: kube-state-metrics
---
apiVersion: v1
kind: Service
metadata:
  labels:
    app: kube-state-metrics
  name: kube-state-metrics
  namespace: prometheus
spec:
  ports:
  - name: kube-state-metrics
    port: 80
    protocol: TCP
    targetPort: 8080
  selector:
    app: kube-state-metrics
  type: ClusterIP
---
apiVersion: monitoring.coreos.com/v1
kind: ServiceMonitor
metadata:
  labels:
    app: kube-state-metrics
    serviceMonitorSelector: prometheus
  name: kube-state-metrics
  namespace: prometheus
spec:
  endpoints:
  - honorLabels: true
    interval: 30s
    path: /metrics
    targetPort: 8080
  jobLabel: kube-state-metrics
  namespaceSelector:
    matchNames:
    - prometheus
  selector:
    matchLabels:
      app: kube-state-metrics
There is a lot going on in the YAML code above. But to summarise, we are creating a Cluster Role called kube-state-metrics that includes all the required RBAC permissions for the service to operate successfully. We then bind the Cluster Role to a Service Account that will be used by the Pod that is created. Speaking of that Pod, we create a Deployment object to actually deploy kube-state-metrics to the prometheus namespace, configuring it to use the Service Account we created. Lastly we create a ClusterIP Service and a ServiceMonitor within the prometheus namespace so that Prometheus can scrape the metrics that are exposed by kube-state-metrics.
Go ahead and install kube-state-metrics into your Kubernetes cluster by executing kubectl apply -f kube-state-metrics.yaml.
You can then use kubectl get pods --namespace prometheus to see the kube-state-metrics Pod being created by Kubernetes. After a brief moment you can then check the configured Targets in Prometheus and you will see that kube-state-metrics is now being successfully scraped.
Useful Metrics
The documenation for kube-state-metrics provides a wealth of useful information on the metrics that are exposed by the service. In a later section, we will look at using these metrics to build powerful dashboards for visualising the health of a Kubernetes cluster.
However before we move on lets take a look at how we can make use of kube-state-metrics.
Lets say we wanted to see all the StatefulSets deployed in the Kubernetes cluster we can use the kube_statefulset_created metric. If we query Prometheus for this metrics, it will return a metric for each StatefulSet in the cluster and include Prometheus Labels that provide us with metadata about the StatefulSet.
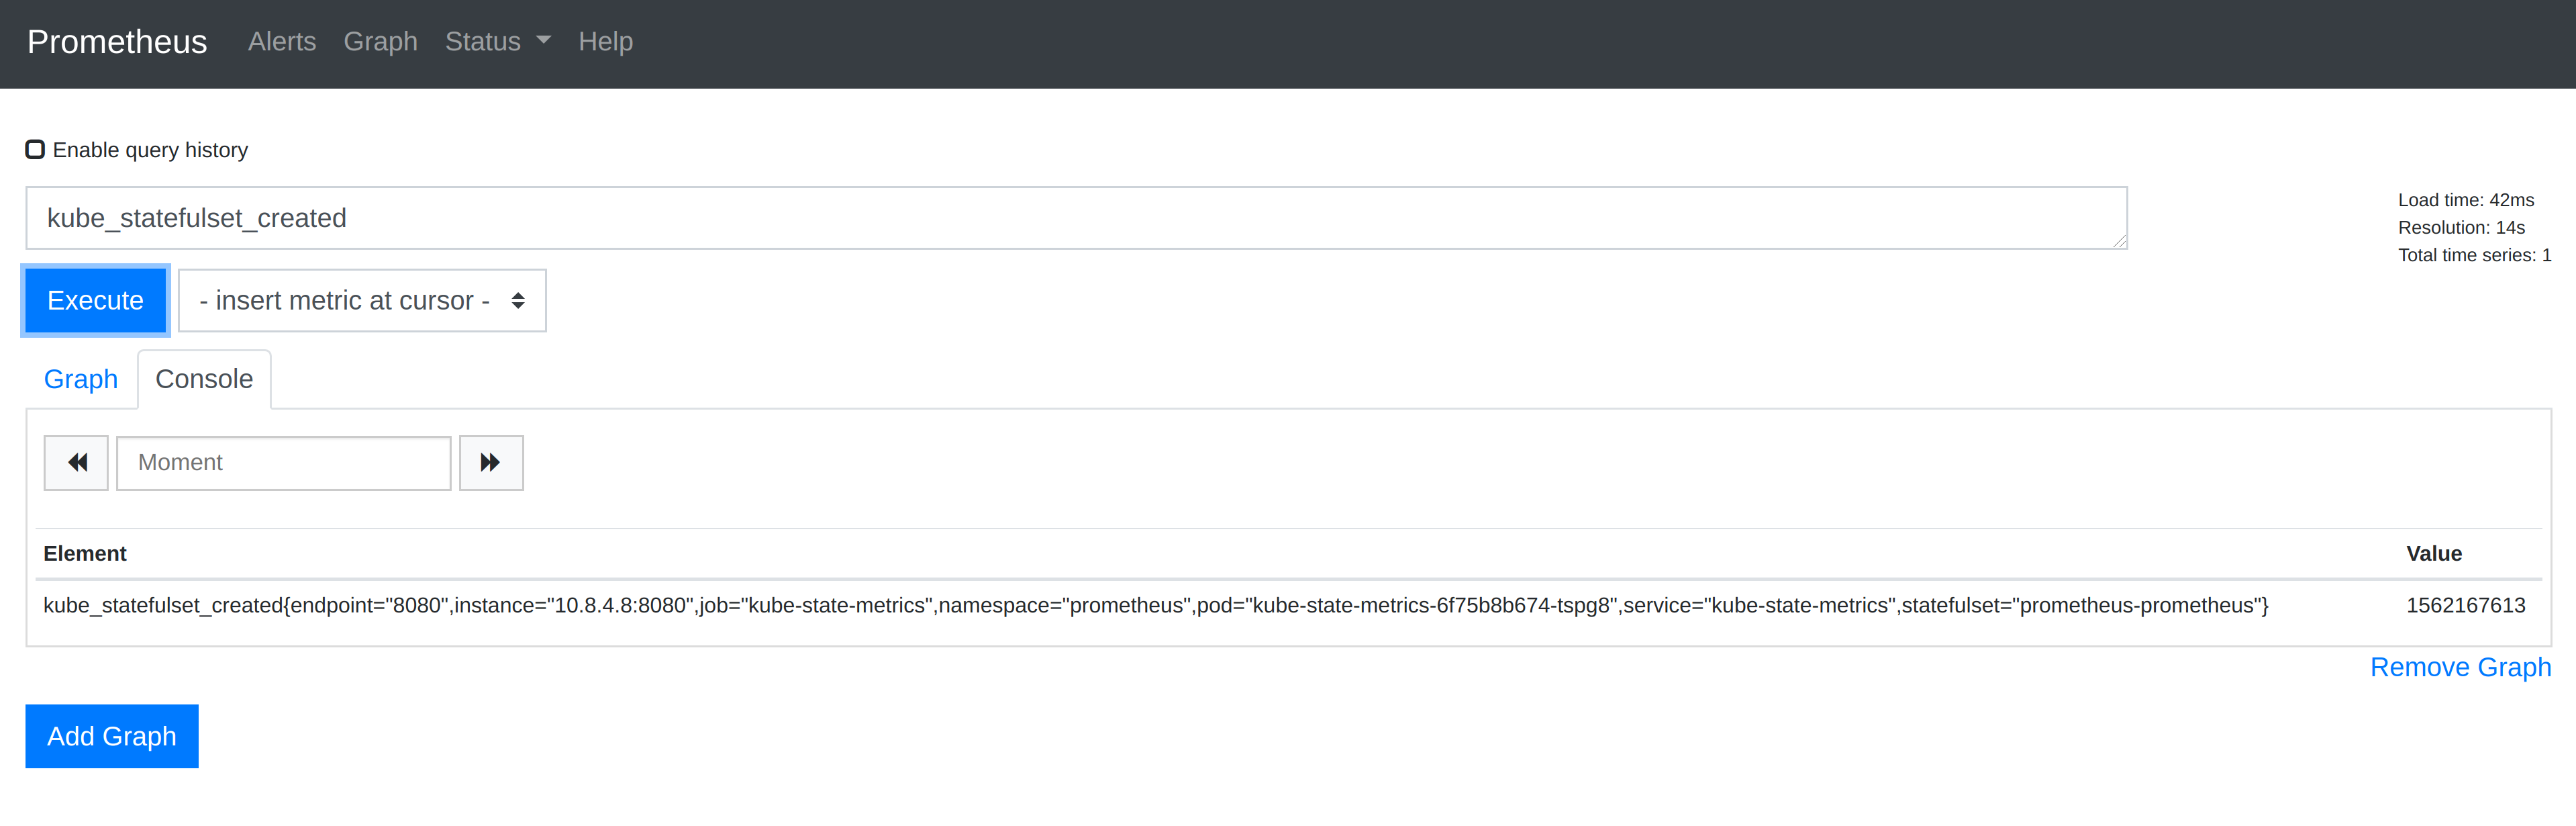
Above we can see that a single metric was returned, which is as follows:
kube_statefulset_created{endpoint=“8080”,instance=“10.8.4.8:8080”,job=“kube-state-metrics”,namespace=“prometheus”,pod=“kube-state-metrics-6f75b8b674-tspg8”,service=“kube-state-metrics”,statefulset=“prometheus-prometheus”} 1562167613
The metric shows that the StatefulSet named prometheus-prometheus in the namespace prometheus was created on 3rd July 2019 at 15:26 UTC. The time comes from the value 1562167613 which is a UNIX timestamp.