Using Service Monitors
Prometheus uses a pull based model for collecting metrics from applications and services. This means the applications and services must expose a HTTP(S) endpoint containing Prometheus formatted metrics. Prometheus will then, as per its configuration, periodically scrape metrics from these HTTP(S) endpoints.
The Prometheus Operator includes a Custom Resource Definition that allows the definition of the ServiceMonitor. The ServiceMonitor is used to define an application you wish to scrape metrics from within Kubernetes, the controller will action the ServiceMonitors we define and automatically build the required Prometheus configuration.
Within the ServiceMonitor we specify the Kubernetes Labels that the Operator can use to identify the Kubernetes Service which in turn then identifies the Pods, that we wish to monitor. Lets look at how we can use Prometheus to scrape metrics from its own inbuilt metrics endpoint.
Using kubectl describe, we can view the Labels on the prometheus-operated service that the Prometheus Operator previously created. If you wish to see this execute kubectl describe service prometheus-operated --namespace prometheus in your terminal or see the example below:
$kubectl describe service prometheus-operated --namespace prometheus
Name:              prometheus-operated
Namespace:         prometheus
Labels:            operated-prometheus=true
Annotations:       <none>
Selector:          app=prometheus
Type:              ClusterIP
IP:                None
Port:              web  9090/TCP
TargetPort:        web/TCP
Endpoints:         10.8.3.7:9090
Session Affinity:  None
Events:            <none>
Now we know this Kubernetes Service has the Label operated-prometheus=true we can create a ServiceMonitor to target this Service. Create a file called servicemonitor.yaml and include the following:
apiVersion: monitoring.coreos.com/v1
kind: ServiceMonitor
metadata:
  labels:
    serviceMonitorSelector: prometheus
  name: prometheus
  namespace: prometheus
spec:
  endpoints:
  - interval: 30s
    targetPort: 9090
    path: /metrics
  namespaceSelector:
    matchNames:
    - prometheus
  selector:
    matchLabels:
      operated-prometheus: "true"
This Kubernetes Resource uses the monitoring.coreos.com/v1 API Version that was installed into Kubernetes by the Prometheus Operator, as explained previously. It uses the namespaceSelector to specify the Kubernetes Namespace in which we wish to locate the Service, in this example above we are selecting within the prometheus namespace. It then uses the selector to specify that it must match the Label operated-prometheus being set as “true”.
Under the endpoints key we must specify one or more scrape targets for the target service. In this example it will scrape each Pod it selects on TCP port 9090 on the URL /metrics every 30 seconds.
Now apply this YAML to the cluster by executing kubectl apply -f servicemonitor.yaml. You can then validate this has been created by execute kubectl get servicemonitor --namespace prometheus:
$kubectl get servicemonitor
NAME                           AGE
prometheus                     1m
Before Prometheus Operator will automatically update the running Prometheus instance configuration to set it to scrape metrics from itself, there is one more thing we must do. On the ServiceMonitor we defined a label on the resource called serviceMonitorSelector, as shown below:
metadata:
  labels:
    serviceMonitorSelector: prometheus
You now need to update the Prometheus Resource configuration to instruct the Prometheus Operator to configure the Prometheus instance using all ServiceMonitors that have the serviceMonitorSelector Label set as prometheus.
Update the previous YAML file you created called prometheus.yaml and add the serviceMonitorSelector key to the Prometheus resource:
  serviceMonitorSelector:
    matchLabels:
      serviceMonitorSelector: prometheus
The updated Prometheus resource should look similar to the example below:
apiVersion: monitoring.coreos.com/v1
kind: Prometheus
metadata:
  name: prometheus
  namespace: prometheus
spec:
  baseImage: quay.io/prometheus/prometheus
  logLevel: info
  podMetadata:
    annotations:
      cluster-autoscaler.kubernetes.io/safe-to-evict: "true"
    labels:
      app: prometheus
  replicas: 1
  resources:
    limits:
      cpu: 1
      memory: 2Gi
    requests:
      cpu: 1
      memory: 2Gi
  retention: 12h
  serviceAccountName: prometheus-service-account
  serviceMonitorSelector:
    matchLabels:
      serviceMonitorSelector: prometheus
  storage:
    volumeClaimTemplate:
      apiVersion: v1
      kind: PersistentVolumeClaim
      metadata:
        name: prometheus-pvc
      spec:
        accessModes:
        - ReadWriteOnce
        resources:
          requests:
            storage: 10Gi
  version: v2.10.0
Now apply this change to the Kubernetes cluster by running kubectl apply -f prometheus.yaml.
After a few moment the Prometheus Operator will automatically update the Prometheus instance you created with the Target configuration to scrape the Prometheus metrics endpoint on the Pod. After a minute or two, check the Prometheus Configuration again, you will see the scrape config appear under the scrape_configs key.
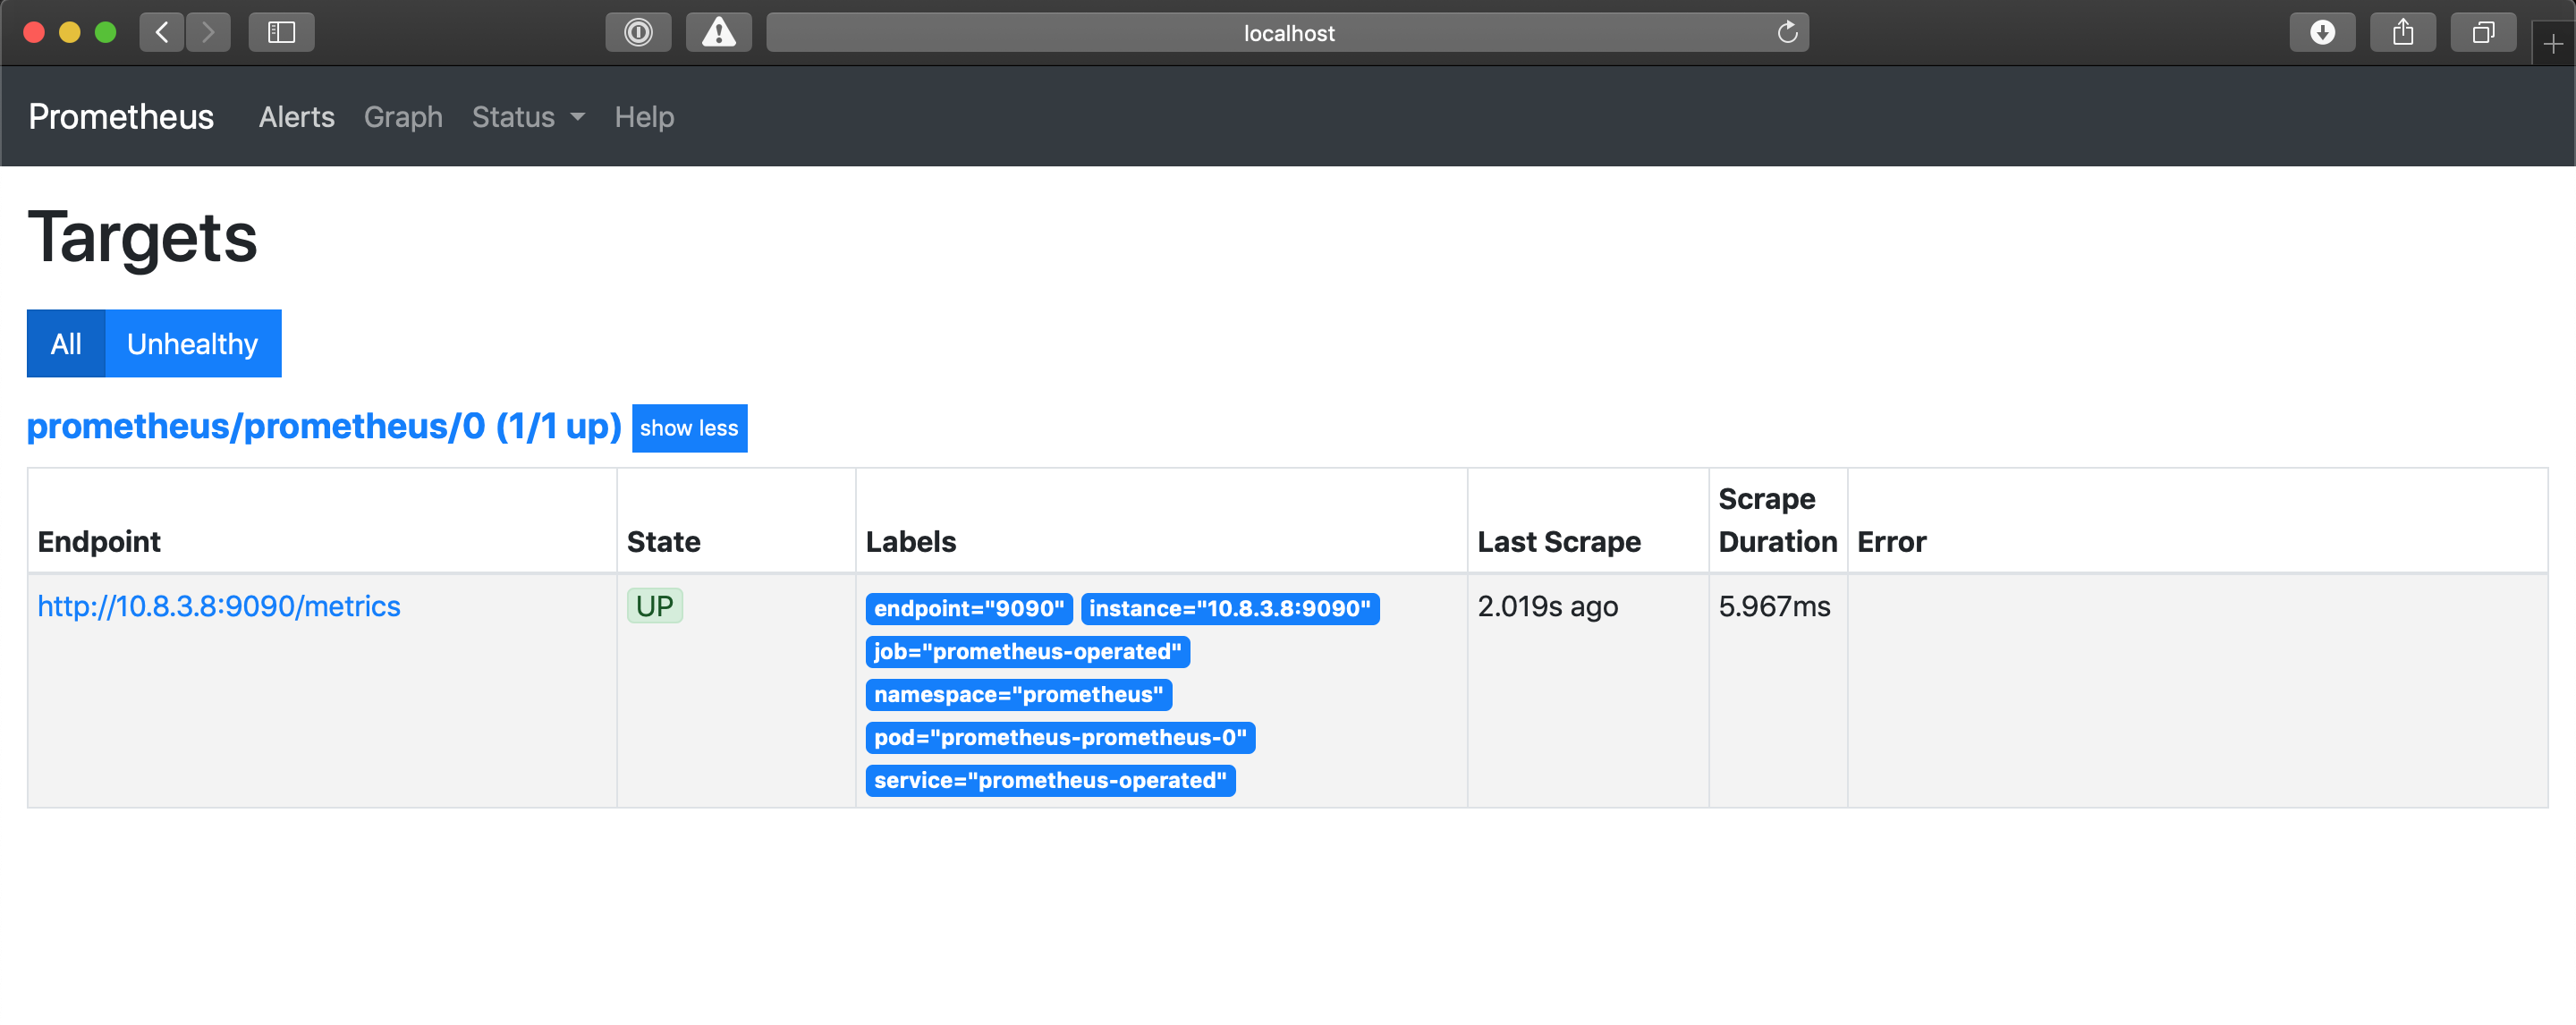
In the Prometheus UI if you select Status > Targets (or go here) you will see details of the target Prometheus has identified, which is the single instance of Prometheus you launched:
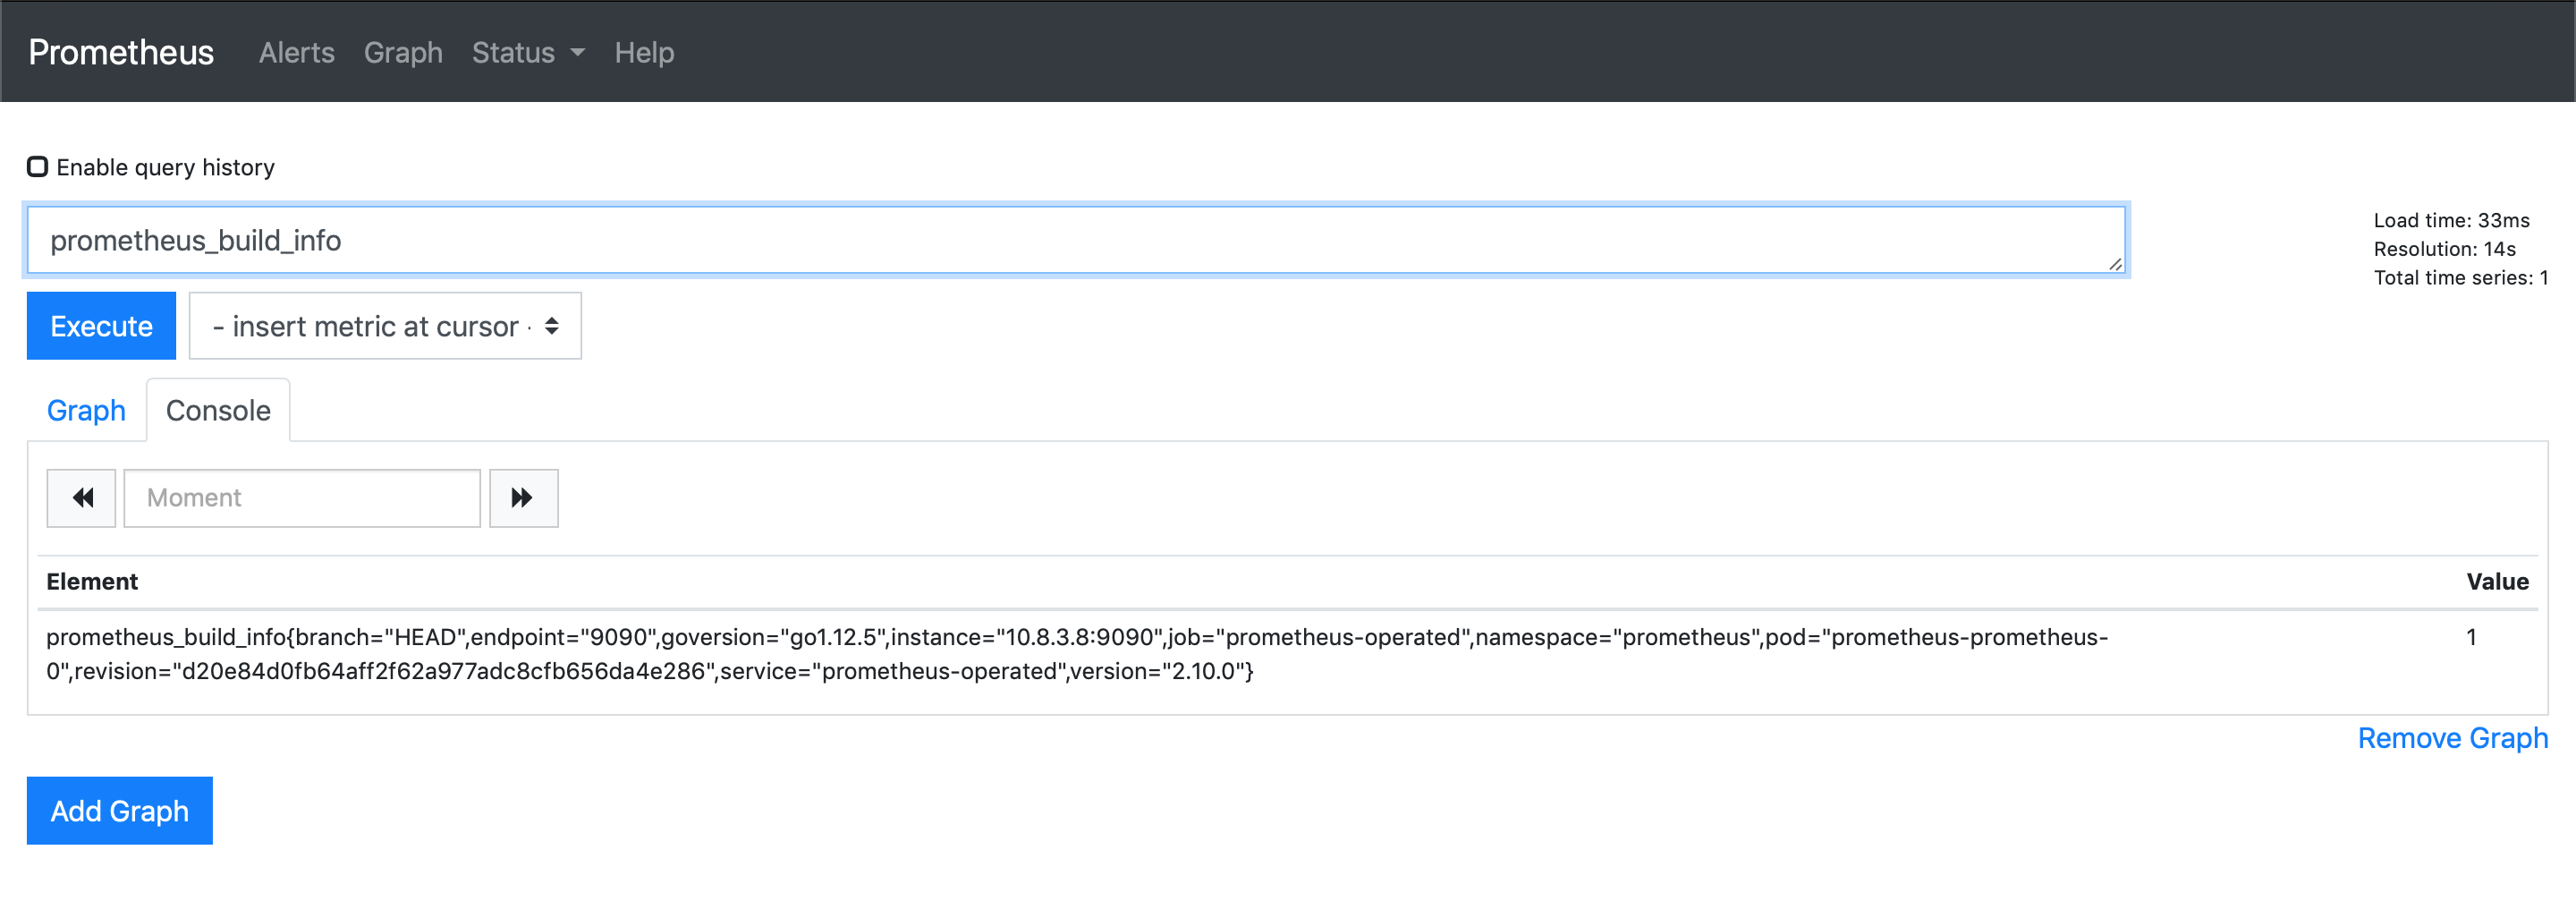
If you now select Graph at the top, the Expression search box will now auto-complete when you start typing. Go ahead and type ‘prometheus’ and you will see some metric names appear. If you select one and click Execute it will query for that metric. Here is an example for prometheus_build_info:
You have now successfully configured Prometheus using the ServiceMonitor. Going forward when adding more services to Kubernetes that require Prometheus monitoring, the ServiceMonitor can be used to configure Prometheus as has been demonstrated.